From Insight to Action: How to Use Warehouse KPIs to Drive Smarter Decisions
Learn essential warehouse KPIs to boost efficiency, accuracy, and profitability. See how Hai Robotics’ automation and data solutions transform operations.
Modern supply chains are under more pressure than ever before. E-commerce growth, rising customer expectations, and global uncertainties have reshaped how warehouses operate. In this environment, data has become more than an operational tool. It is a strategic asset.
Warehouses that rely only on intuition or legacy processes often face recurring inefficiencies such as inaccurate inventory counts, delayed shipments, or excessive labor costs. On the other hand, companies that measure performance with well-defined key performance indicators, or KPIs, can align operations with business goals, react faster to disruption, and continuously improve.
The core idea is simple: what gets measured gets managed. KPIs provide the lens through which warehouses can see reality more clearly and make smarter decisions.
What Are Warehouse KPIs?
A warehouse KPI is a quantifiable measure of performance against defined objectives. KPIs allow managers to assess how well specific processes are running and whether the warehouse is meeting broader organizational expectations.
There are two categories of KPIs to understand.
-
Operational KPIs focus on daily performance. They measure the efficiency and accuracy of activities such as picking, packing, receiving, and storage. Examples include order accuracy or dock-to-stock time. These indicators are often used by supervisors to manage teams and workflows.
-
Strategic KPIs go beyond daily operations and evaluate the warehouse’s contribution to business outcomes. Examples include inventory turnover or labor cost per order. These indicators are typically used by senior leaders to assess profitability, scalability, and customer satisfaction.
Together, operational and strategic KPIs provide both a microscope and a telescope. One reveals detail in day-to-day processes while the other keeps sight of long-term objectives.
Essential KPIs for Warehouse Performance
Warehouses generate large volumes of data, but not every number is equally useful. The following ten KPIs are widely recognized across the industry, and together they provide a comprehensive view of warehouse performance.
Order Accuracy Rate
Order accuracy measures the percentage of orders shipped correctly. A high accuracy rate indicates that picking and packing processes are reliable. An error-prone process can damage customer trust and generate hidden costs through returns, re-picking, and reshipping.
Industry benchmark: Many best-in-class warehouses target 99.5 percent or higher accuracy¹.
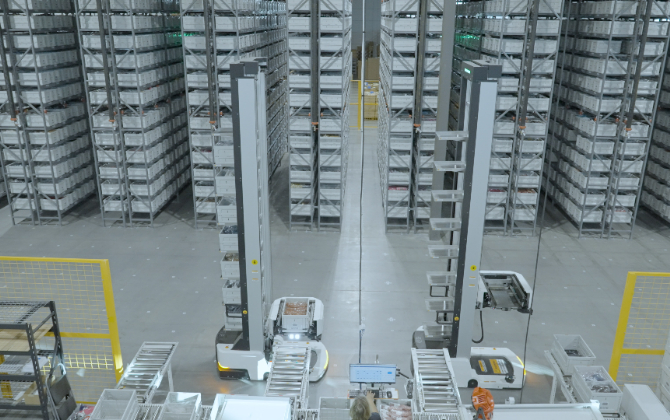
Example: Even well-trained operators can mis-pick due to fatigue, distractions, or simple oversight. A retailer processing 20,000 daily orders at 99.5 percent accuracy would ship about 100 incorrect orders per day, but errors jump to 1,000 if accuracy drops to 95 percent. Automation changes the equation. ARSR, such as robots and goods-to-person workstations, minimize manual operations and provide operators with clear, step-by-step instructions on what to pick and when. This drives accuracy above 99%, reduces errors dramatically, and safeguards both efficiency and customer loyalty.
Inventory Accuracy
Inventory accuracy reflects how closely recorded stock levels match physical counts. Inaccurate inventory leads to stockouts, misplaced items, and overstocking.
Benchmark: World-class operations often achieve greater than 97 percent accuracy¹.
Application: In manual warehouses, mismatches often come from misplaced stock or delayed updates. Automation such as ASRS continuously validates inventory through real-time scanning and automated putaway, minimizing human error and keeping records closely aligned with physical counts.
Order Cycle Time
This KPI measures the average time from order receipt to order shipment. It is a critical measure of responsiveness, especially in e-commerce and fast-moving consumer goods.
Benchmark: Same-day or next-day fulfillment is increasingly becoming standard in many industries.
Example: A warehouse with a cycle time of 24 hours may lose competitiveness against rivals offering a 6-hour turnaround¹. Shorter cycle times often require a mix of efficient workflows and automation. Robots can move goods at higher speeds and reduce long walking distances for workers. They work on multiple orders in parallel and operate around the clock without breaks. These capabilities can cut cycle times from a full day to just a few hours, giving your warehouses the responsiveness needed to stay competitive.
Picking Productivity
Picking productivity evaluates the number of orders or lines picked per labor hour. It is one of the most labor-sensitive KPIs since picking can account for more than 50 percent of warehouse labor costs.
Benchmark: Instead of workers spending over half their time walking between aisles, robots deliver items directly to picking stations. This reduces unproductive travel and allows pickers to focus on accuracy, leading to higher throughput per labor hour. Automation, such as goods-to-person systems, can double or triple productivity compared to manual picking.
Dock to Stock Time
This measures the speed at which received goods are made available for sale or order fulfillment. Faster dock-to-stock time accelerates cash flow and reduces holding costs.
Benchmark: Many warehouses aim for less than 8 hours. Automated processes can reduce it to under 3 hours¹.
Space Utilization
This KPI calculates how effectively warehouse space is used compared to total capacity. Inefficient layouts waste both real estate and capital.
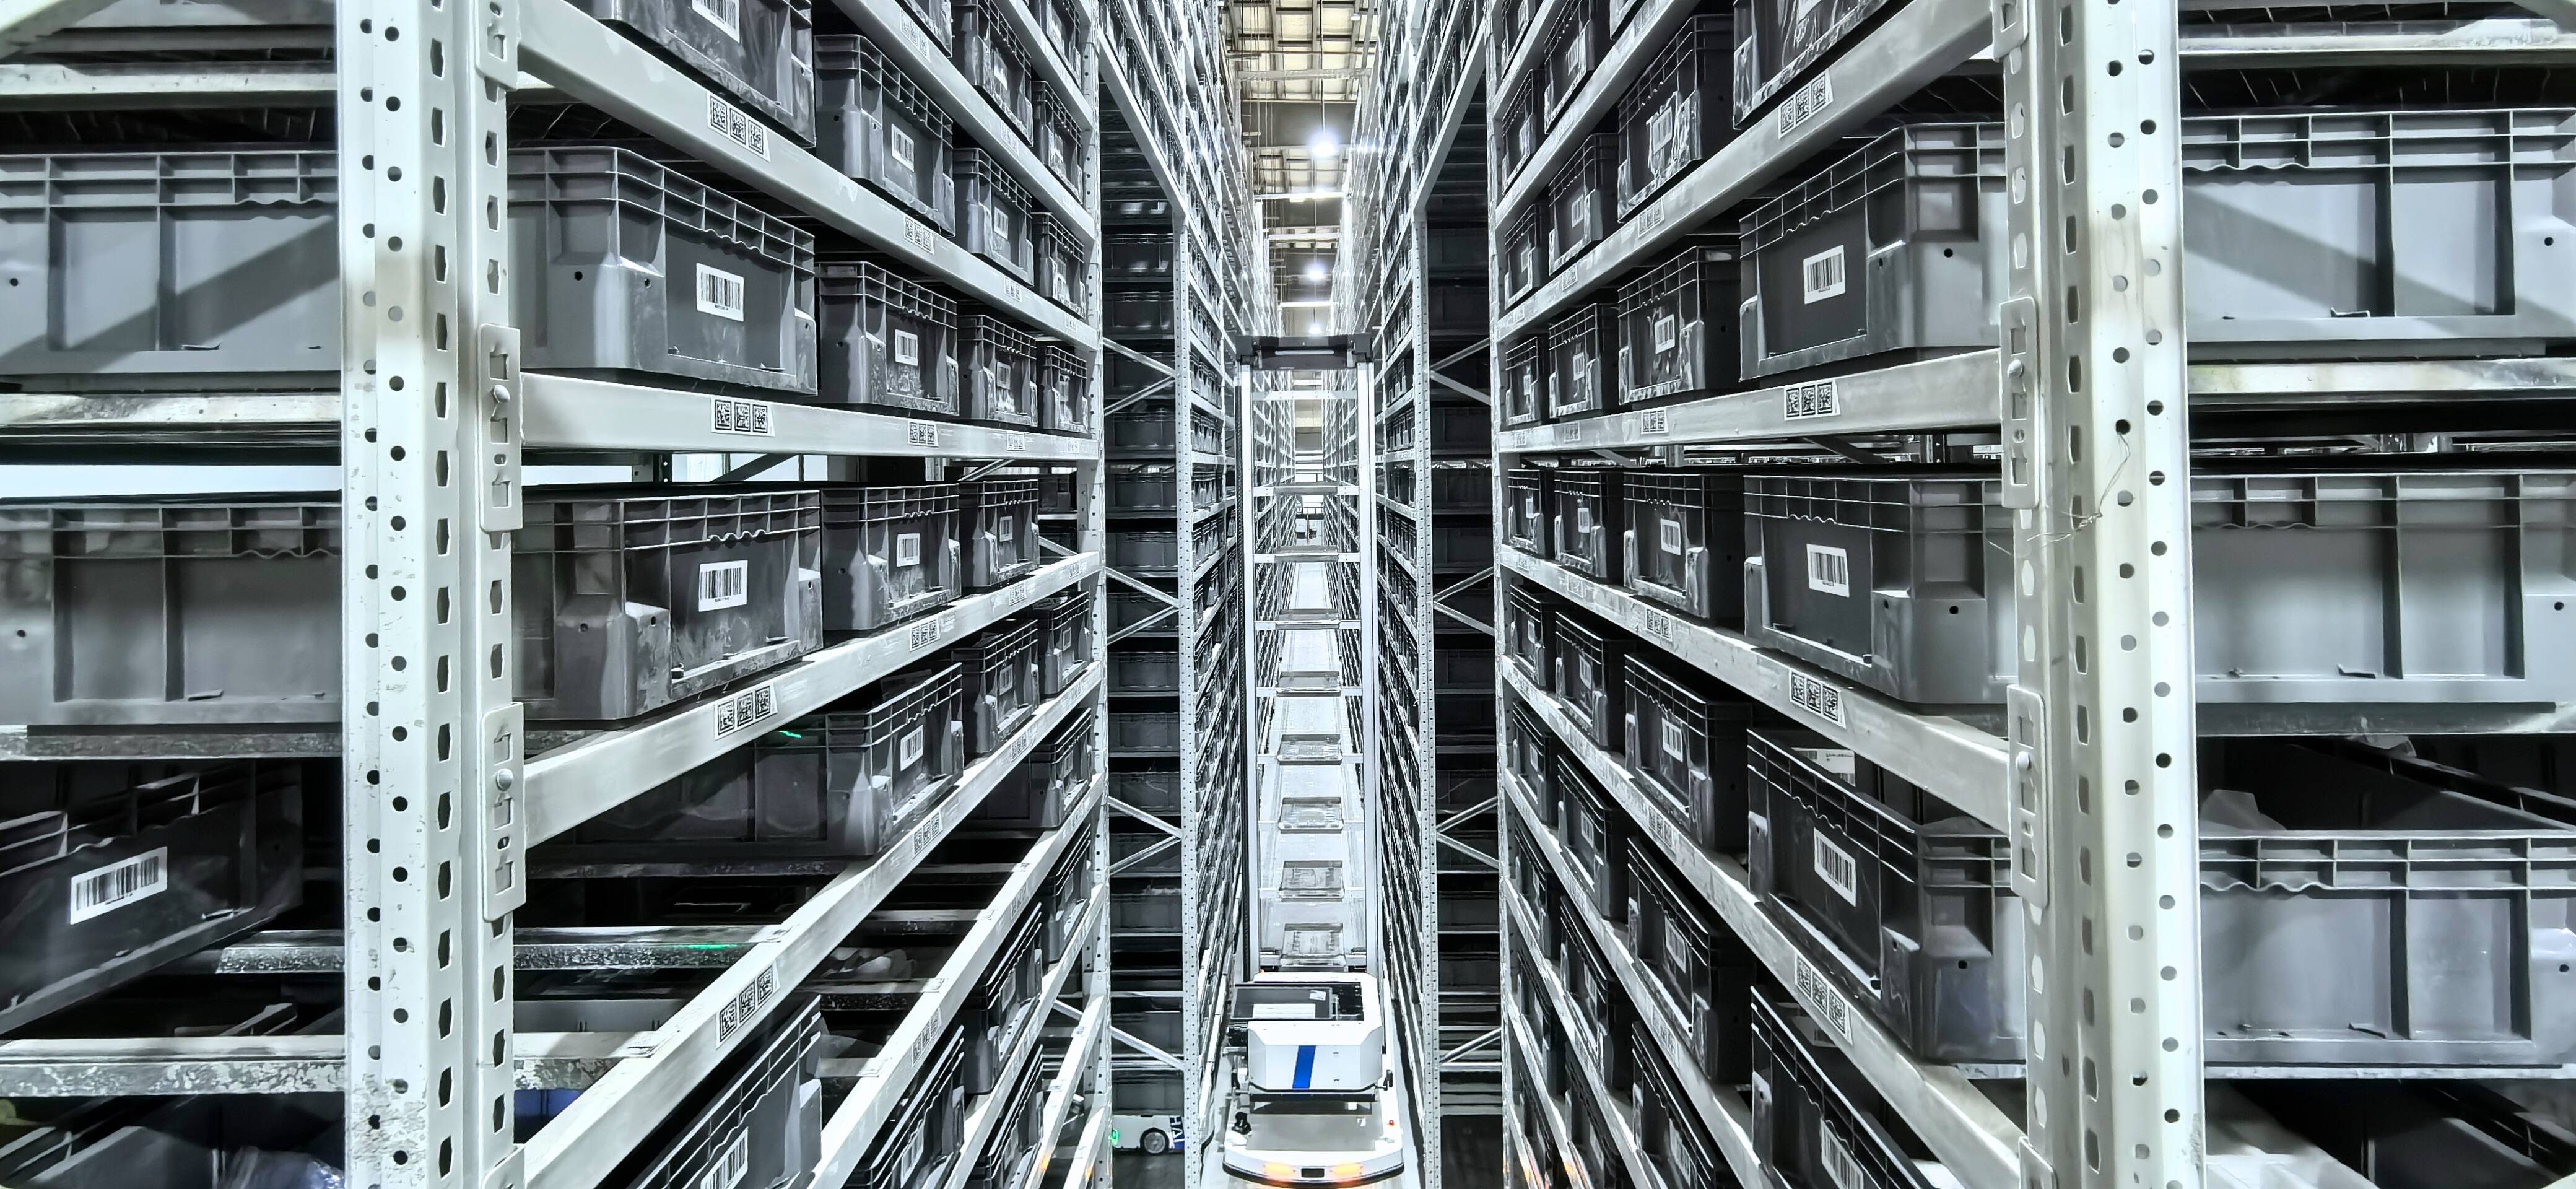
Example: By implementing an ASRS with higher vertical reach, a warehouse can increase utilization from 65 percent to more than 90 percent without expanding its footprint. Automated systems make it possible to fully leverage vertical space, achieving up to six times the storage density while reducing floor space requirements by as much as 75 percent. This allows your businesses to scale capacity without costly warehouse expansion.
On-Time Shipment Rate
This measures the proportion of orders shipped by the promised date. Reliability in shipping builds customer confidence and reduces penalty costs in industries with strict service level agreements.
Benchmark: A rate above 98 percent is often considered world-class¹.
Example: Automated storage and retrieval systems boost throughput efficiency, enabling orders to be fulfilled in under two minutes. This helps your warehouses consistently meet promised shipping windows and maintain high service-level compliance.
Backorder Rate
Backorders occur when demand cannot be fulfilled immediately due to stockouts. A high backorder rate indicates poor demand forecasting or inventory management.
Impact: Each delayed order can represent a lost sale or an unhappy customer, especially in industries with low switching costs.
Inventory Turnover
Inventory turnover measures how many times inventory is sold and replaced within a given period. Higher turnover generally indicates strong sales, accurate demand planning, and efficient inventory practices.
Benchmark: Grocery distribution centers may turn inventory more than 20 times per year. Industrial parts warehouses may average 3 to 5 turns annually².
Labor Cost per Order
This KPI evaluates labor costs relative to the number of fulfilled orders. Rising labor costs often indicate inefficiencies or inadequate automation.
Application: By introducing robotics for repetitive tasks, warehouses can reduce labor costs per order while reallocating staff to higher-value activities.
How to Collect and Analyze KPI Data
The strength of KPIs lies in the accuracy of the data supporting them. Successful warehouses combine multiple data sources into a unified view.
-
WMS and ERP integration ensures consistent tracking of orders, inventory, and financials.
-
ASRS systems automatically record storage, retrieval, and movement data with precision.
-
IoT sensors provide real-time monitoring of equipment usage, environmental conditions, and material flow.
-
Artificial intelligence and machine learning help forecast demand, optimize replenishment, and detect anomalies in KPI performance.
Real-time dashboards empower managers to make quick decisions during daily operations. Periodic reporting highlights long-term trends and supports strategic planning. Business intelligence platforms can merge both views, offering advanced visualization and predictive insights.

Using KPIs to Identify Bottlenecks and Opportunities
Once data is collected, the next step is to interpret it. KPIs allow managers to diagnose bottlenecks and discover hidden opportunities for optimization.
-
If order accuracy falls below the target, root cause analysis may reveal training gaps, poor workstation ergonomics, or incorrect system configurations.
-
If dock-to-stock time is consistently high, the bottleneck may lie in receiving processes, labeling, or insufficient storage availability.
-
If labor cost per order is increasing, opportunities may include workforce optimization, cross-training, or the introduction of automated systems.
Setting performance benchmarks creates accountability. A continuous improvement loop, where KPI results feed back into process changes, helps warehouses adapt to new challenges while ensuring progress is measurable.
From Reports to Results: Turning Insights Into Action
Data is only valuable when it drives change. Warehouses that embed KPIs into decision-making can transform insights into measurable results.
-
Resource allocation: Labor scheduling can be based on demand forecasts derived from KPI trends.
-
Layout redesign: Space utilization data can inform rack configuration, picking paths, or ASRS installation to maximize throughput.
-
Automation investment: High labor cost per order combined with slow picking productivity provides a clear case for automation.
-
Employee engagement: Sharing KPIs with frontline staff helps connect daily work with organizational goals, motivating teams with clear performance targets.
A culture where data is transparent and actionable ensures that warehouses move beyond static reports into a cycle of learning and improvement.
How Hai Robotics Turns KPIs Into Results
KPIs are only valuable when they lead to better outcomes. Hai Robotics provides tools to make this possible. Our ASRS solutions help warehouses optimize inventory management, improve order picking accuracy, and maximize space utilization. For a deeper dive into how inventory optimization can transform operations, explore our dedicated blog on inventory optimization strategies.
With HaiQ, our smart software platform, managers can access visual dashboards that display real-time operational data. This visibility enables faster, better-informed decisions and creates a direct link between KPI monitoring and action.
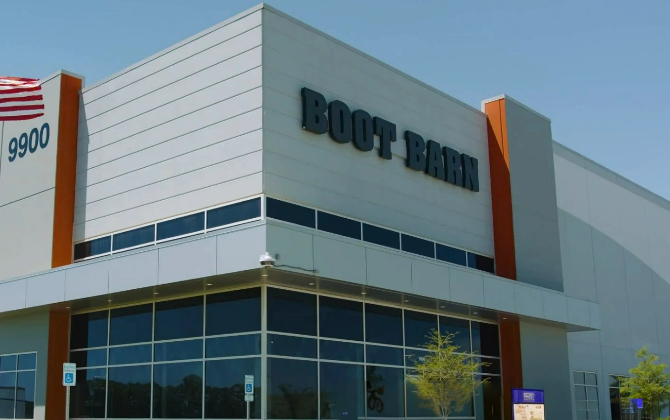
The impact is evident in real-world projects. For example, Boot Barn achieved a 100% order picking accuracy after adopting the HaiPick System 1, demonstrating how automation and data visibility can deliver measurable improvements in critical KPIs.
Curious to see how KPI-driven automation could impact your business? Use our ROI Calculator to estimate the benefits for your warehouse.
References
- Warehousing Education and Research Council (WERC). DC Measures 2023: A Benchmarking Report.
- Council of Supply Chain Management Professionals (CSCMP). Supply Chain Management Annual Report 2023.
- Gartner. Key Metrics for Warehouse Management, 2022. 5) McKinsey & Company. The Future of Automated Warehousing, 2021.
